From Chaos to Clarity: How RDTS Turns Data into Action
From Chaos to Clarity: How RDTS Turns Data into Action
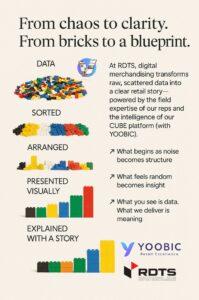
In retail, there’s no shortage of data. But too often, that data remains scattered, raw, or simply unused.
At RDTS, we take what looks like noise and transform it into structured, actionable retail intelligence. Powered by our Cube© platform and YOOBIC, here’s how we do it, step by step.
From bricks to a blueprint: 5 key steps
1. Raw data
Photos, audits, inventory snapshots, out-of-stocks, display checks… our field reps collect it all, every day. That’s the base.
2. Sorted
Using Cube©, that raw input is filtered, categorized, and contextualized automatically.
3. Structured
Gaps and compliance issues become visible. The data gains clarity and direction.
4. Visualized
Through custom dashboards, KPIs, and real-time graphs, the story becomes easy to read and easy to share.
5. Explained
Each report tells a story: what happened, where, and what needs to happen next. Data becomes narrative, not just numeric.
What are the results?
- +26% average improvement in planogram compliance
- Faster interventions, fewer lost sales
- Stronger connection between field and HQ
Are your data points telling you anything?
At RDTS, we transform disconnected bricks into a clear, aligned execution strategy, one that delivers real impact on the ground.
Want to see how? Let’s talk.